📅 AAU data available: 12 Sep 2025 00:10 – 15 Sep 2025 00:00 | ⏱ Recommended logging interval: 10 min
📅 Data updated daily at 02:00 UTC — latest available:
📅 Data updated daily at 02:00 UTC — latest available:
📅 TOFAS data available: 10 Dec 2025 00:00 – 17 Dec 2025 23:59 | ⏱ Recommended logging interval: 1 min
📅 Data updated daily at 02:00 UTC — latest available:
✓
Loading real-time data and calculating KPIs
Connecting to data centre...
EMPA · Direct to Chip Two-Phase Liquid Cooling
Start Time
End Time
Interval (min)
Contact us for deployment of FluxTwin™ Insight in your data centre
System Performance▶
Visualization Controls▶
Temperature Scale
Rack Opacity
20%
Node Analytics
—
—
Inlet
—
Outlet
—
CPU
—
CPU %
—
Power
—
ASHRAE Inlet Compliance
15°C182732°C
Cooling System Temperatures▶
Air Supply
—
Air Return
—
HRU Water Inlet
—
HRU Water Outlet
—
⏳Ready
✅
📅
🕐
⏱
KPI Trend
Server Detail
EN 50600-5-1 · Data Centre Maturity Model (DCMM)
CLC/TS 50600-5-1 · Energy Management & Environmental Sustainability
CLC/TS 50600-5-1 is the European standard defining a Data Centre Maturity Model (DCMM) for energy management and environmental sustainability. Published by CENELEC and updated in 2023, it provides a structured framework for data centre operators to assess their current practices, identify improvement opportunities, and progress toward higher levels of efficiency, in alignment with the EU Green Deal and the EU Code of Conduct for Data Centre Energy Efficiency.
Key Assessment Domains
⚡Energy Performance & Efficiency
📊Monitoring & Measurement Capability
⚙️Operational Processes & Documentation
♻️Continuous Improvement & Sustainability
Five Maturity Levels
Level
Name
Key Characteristics
1
Initial
Data collection minimal or absent. No formal KPIs. Entirely reactive management — issues addressed only after they occur. No documented processes for energy or sustainability.
2
Managed
Basic KPIs (e.g. PUE) measured. Partial monitoring in place. Mostly manual reporting. Some awareness of energy patterns, but no structured improvement plan. Aligned with EU CoC baseline.
3
Defined
Standardised KPI sets (PUE, ERF, WUE) actively used. Processes formally documented. Data collected on a regular schedule. Responsibilities clearly assigned. Targets set and reviewed periodically.
4
Quantitatively Managed
Automated data collection via DCIM/SCADA. Decisions driven by KPI dashboards and trend analysis. Benchmarking performed. Waste heat reuse in place. Carbon & water metrics (CUE, WUE) tracked.
5
Optimizing
Real-time optimisation via AI/ML models and digital twins. Continuous improvement embedded in operations. Full circular economy principles. External waste heat distribution. Full alignment with EU taxonomy & Green Deal.
Note: The DCMM is applicable to all data centres regardless of size or type. Partial progress is recognised at each level. Certification can be obtained through accredited bodies such as TÜV SÜD or TÜV NORD under the TSI.EN50600 scheme.
Assessment Criteria by Level
Level
Key Requirements
1 · Initial
No formal energy management programme. No KPI tracking. No dedicated roles for sustainability. Energy bills reviewed at most annually.
2 · Managed
At least 1 KPI (e.g. PUE) measured regularly. Basic metering infrastructure in place. Annual energy report produced. At least one person responsible for energy management.
3 · Defined
Minimum 3 KPIs measured and reported on a defined schedule. Documented energy management policy. Targets set with review cycles. Data retained for trend analysis (≥12 months).
4 · Quantitatively Managed
Automated KPI collection (DCIM/SCADA/BMS). Real-time dashboards operational. Benchmarking against external data centres. Waste heat reuse documented. Carbon & water KPIs tracked. Formal improvement roadmap in place.
5 · Optimizing
AI/ML-driven optimisation active. All major KPIs automated and integrated. External waste heat distribution to third parties. Full lifecycle & circular economy assessment. Annual third-party sustainability audit. Aligned with EU taxonomy disclosures.
KPI Coverage by Maturity Level
KPI
L1
L2
L3
L4
L5
PUE — Power Usage Effectiveness
✗
✔
✔
✔
✔
COP — Coefficient of Performance
✗
~
✔
✔
✔
RTI — Return Temperature Index
✗
✗
~
✔
✔
RHI — Rack Heat Index
✗
✗
~
✔
✔
RCI — Rack Cooling Index
✗
✗
~
✔
✔
ERF — Energy Reuse Factor
✗
✗
~
✔
✔
WUE — Water Usage Effectiveness
✗
✗
✗
~
✔
CUE — Carbon Usage Effectiveness
✗
✗
✗
~
✔
REF — Renewable Energy Factor
✗
✗
✗
~
✔
✔ Required · ~ Optional/Expected · ✗ Not applicable at this level
Assessment Report
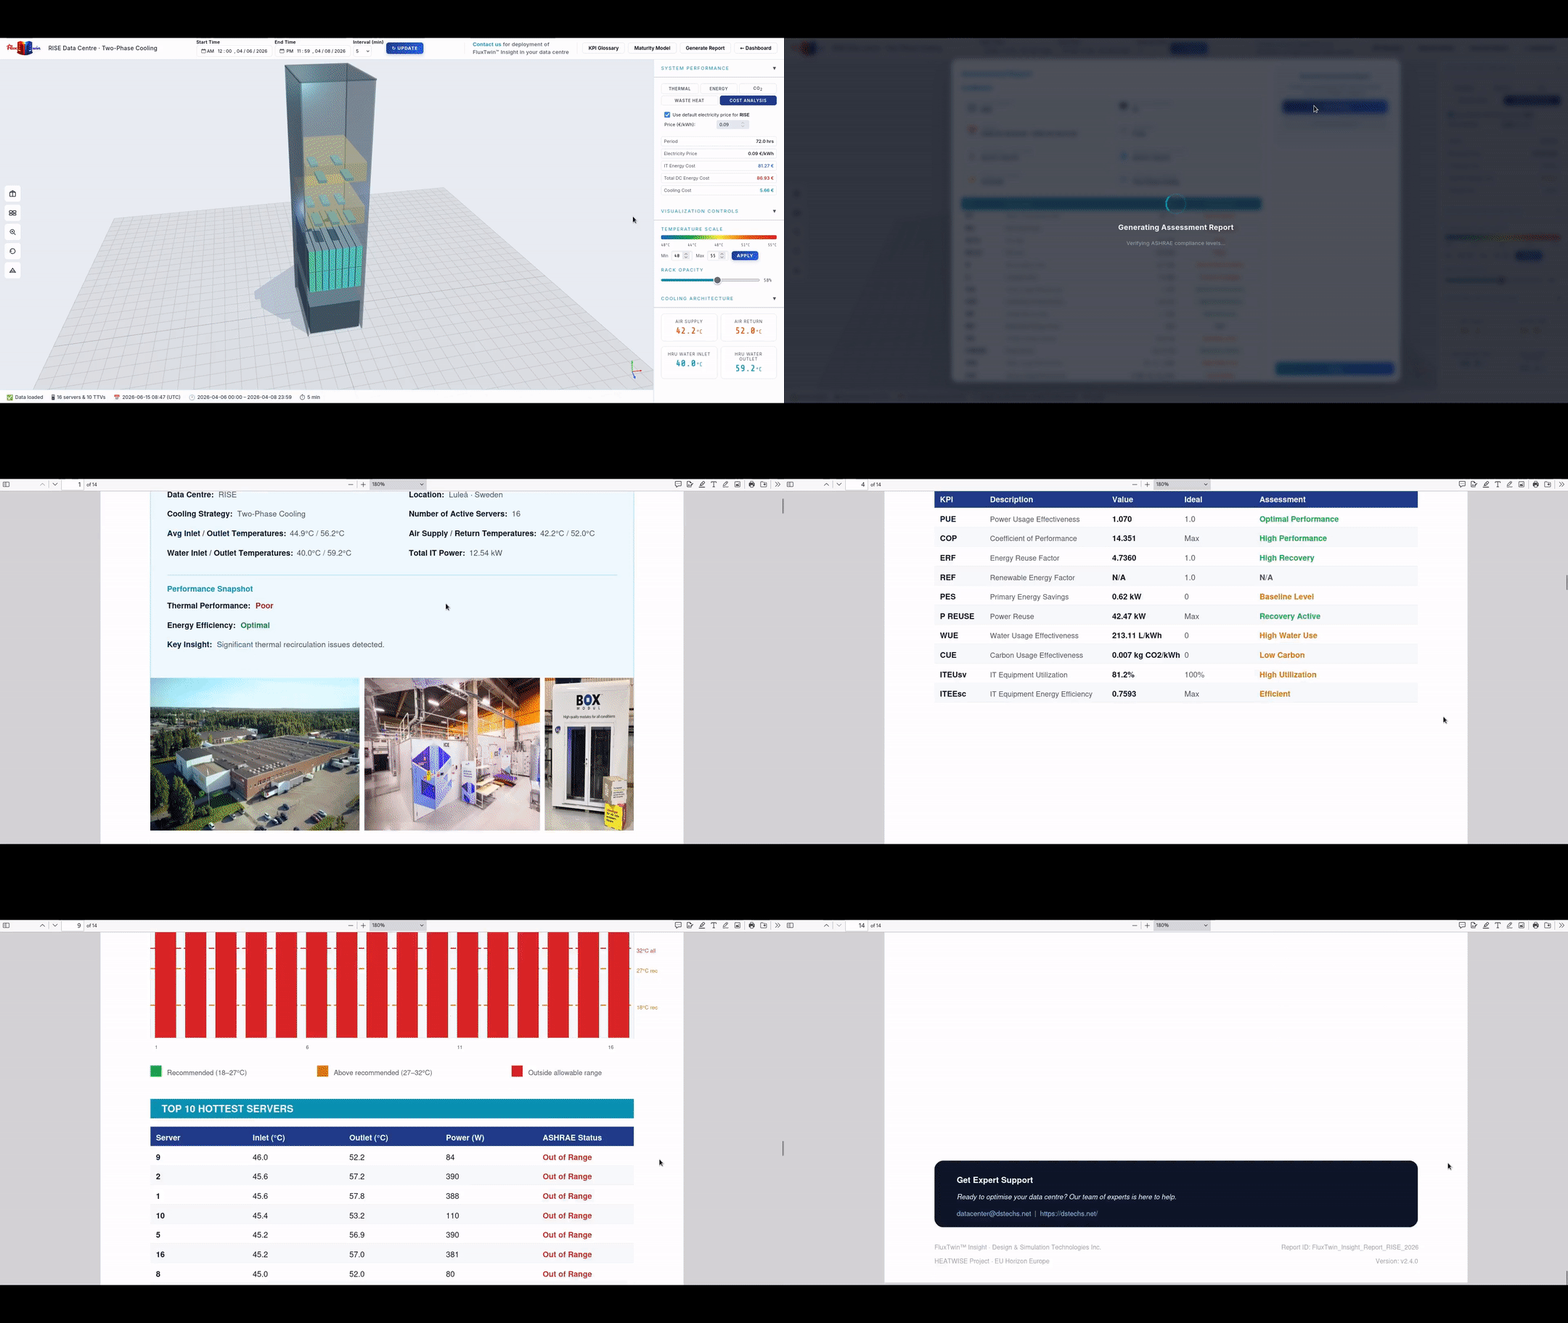
Generate Assessment Report
Creates a comprehensive PDF with KPI analysis, charts, and ASHRAE compliance.
✅
Assessment Report Ready
The comprehensive analysis for the selected period has been successfully generated. You can now download your PDF report.
Get in touch to learn more about FluxTwin™ Insight deployment.
✓
Message Sent!
Thank you for your interest in the Self-Assessment Tool. We will get back to you at the earliest opportunity.
🖥️
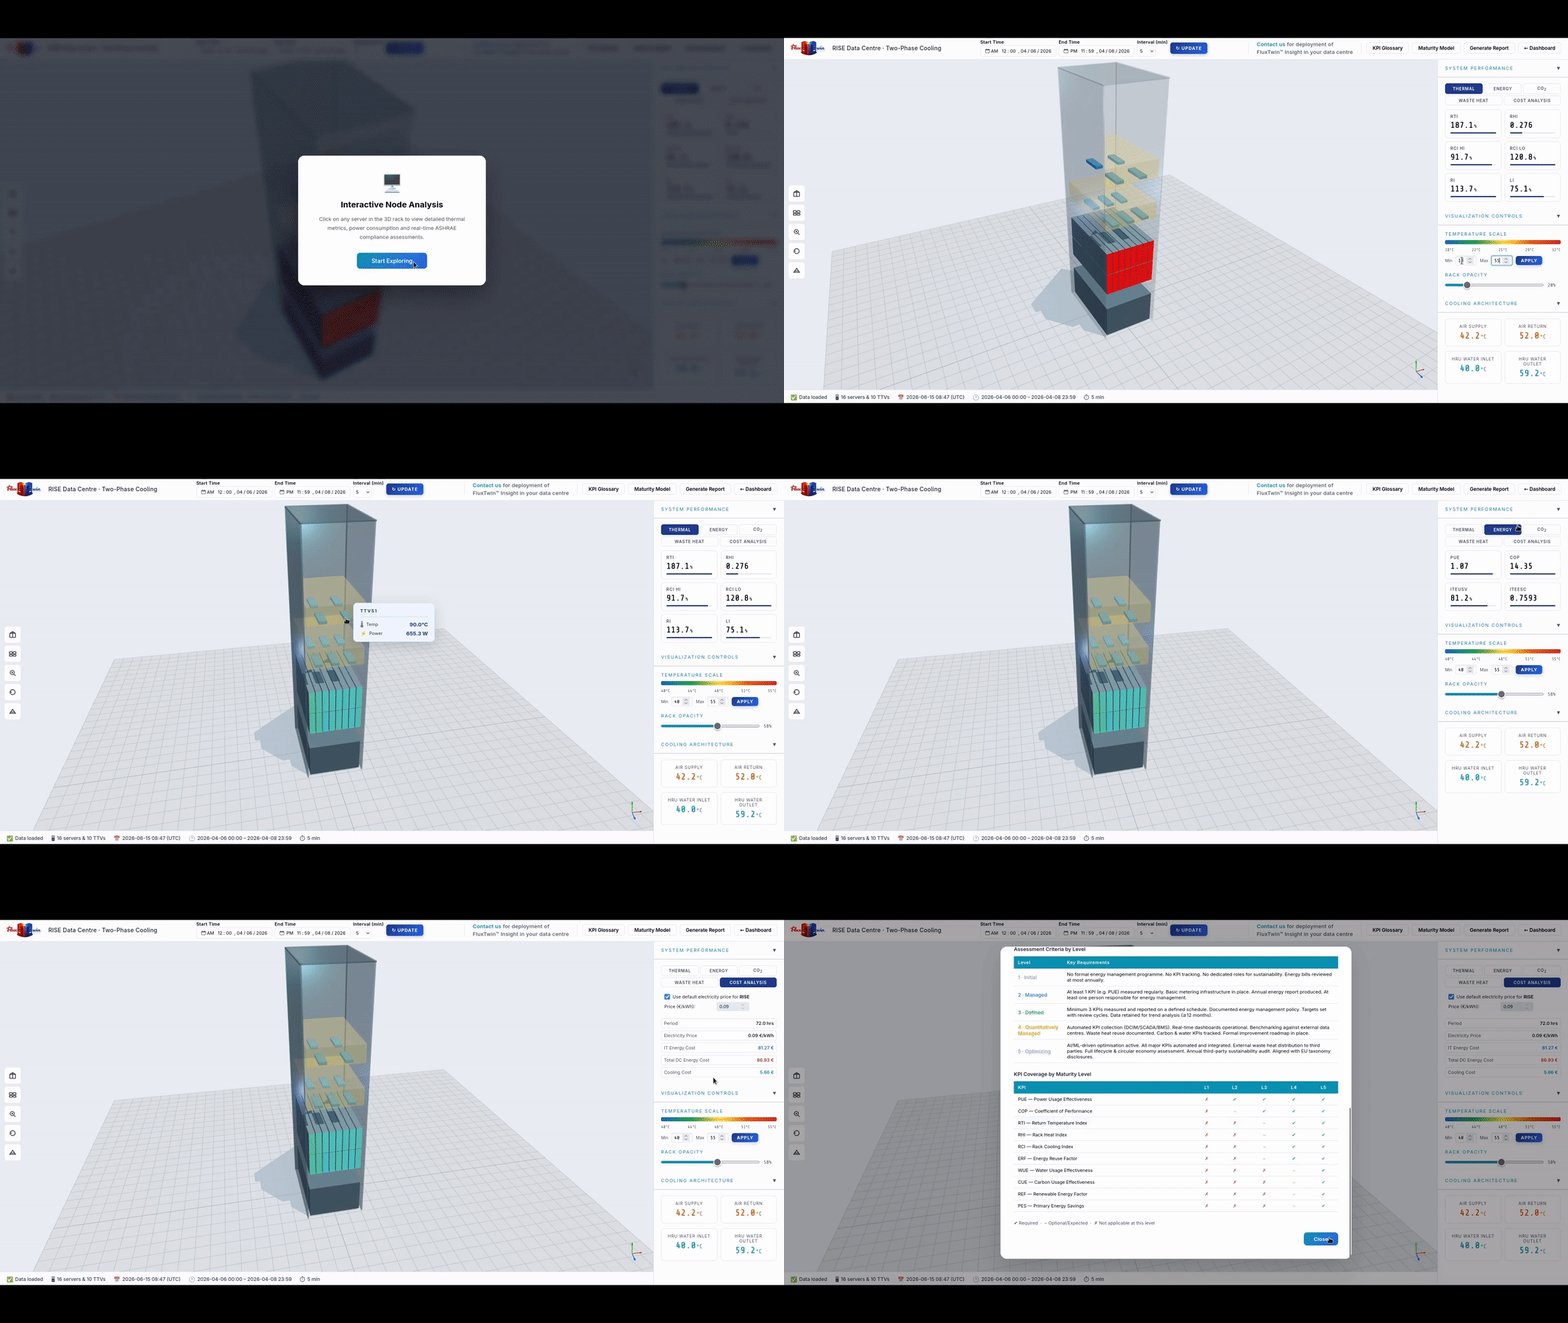
Interactive Node Analysis
Click on any server in the 3D rack to view detailed thermal metrics, power consumption and real-time ASHRAE compliance assessments.
🔒
PSNC Access Required
Enter password to access PSNC data centre
Incorrect password. Please try again.
Quick Guide
How to Use FluxTwin Insight
1
2
3
4
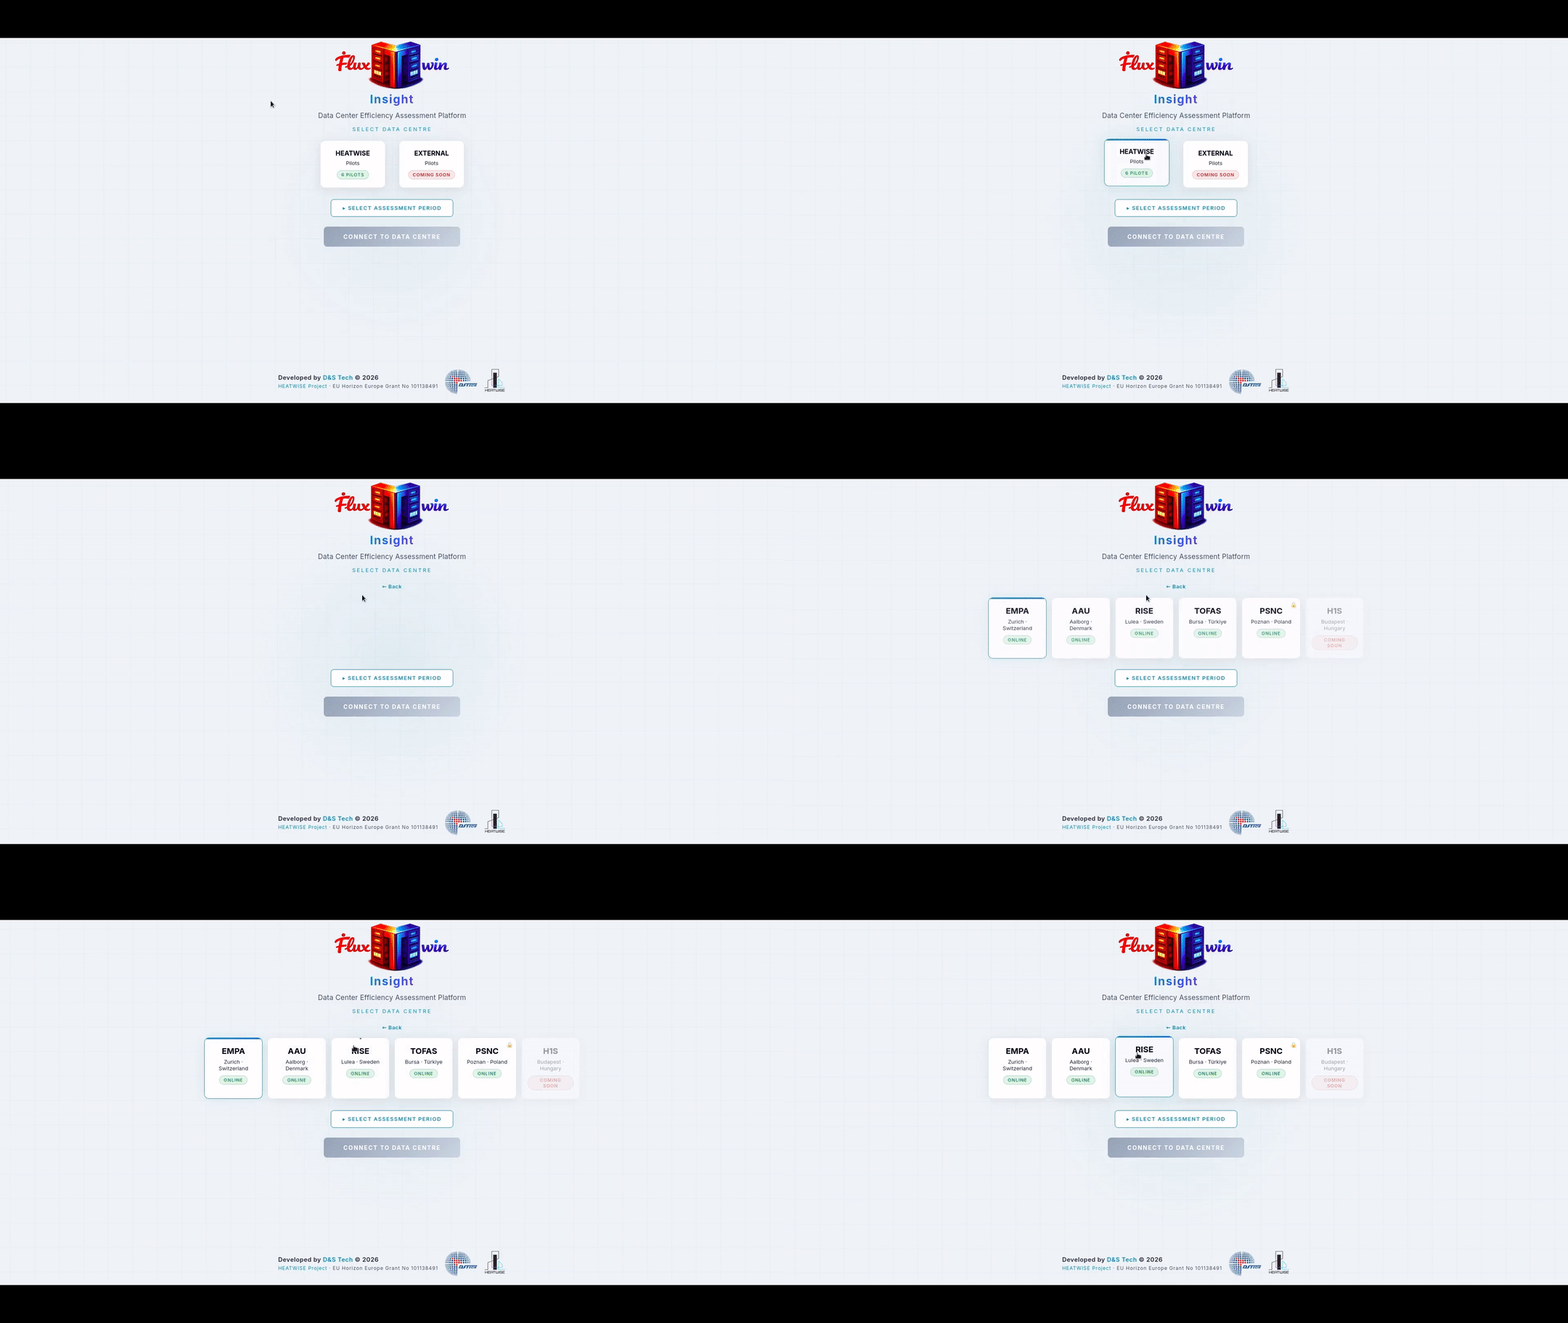
Step 1 — Select Data Centre
Choose your data centre from the Heatwise pilots. Select EMPA, RISE, PSNC or other available pilots to begin your assessment. Each data centre displays its location and current connection status.
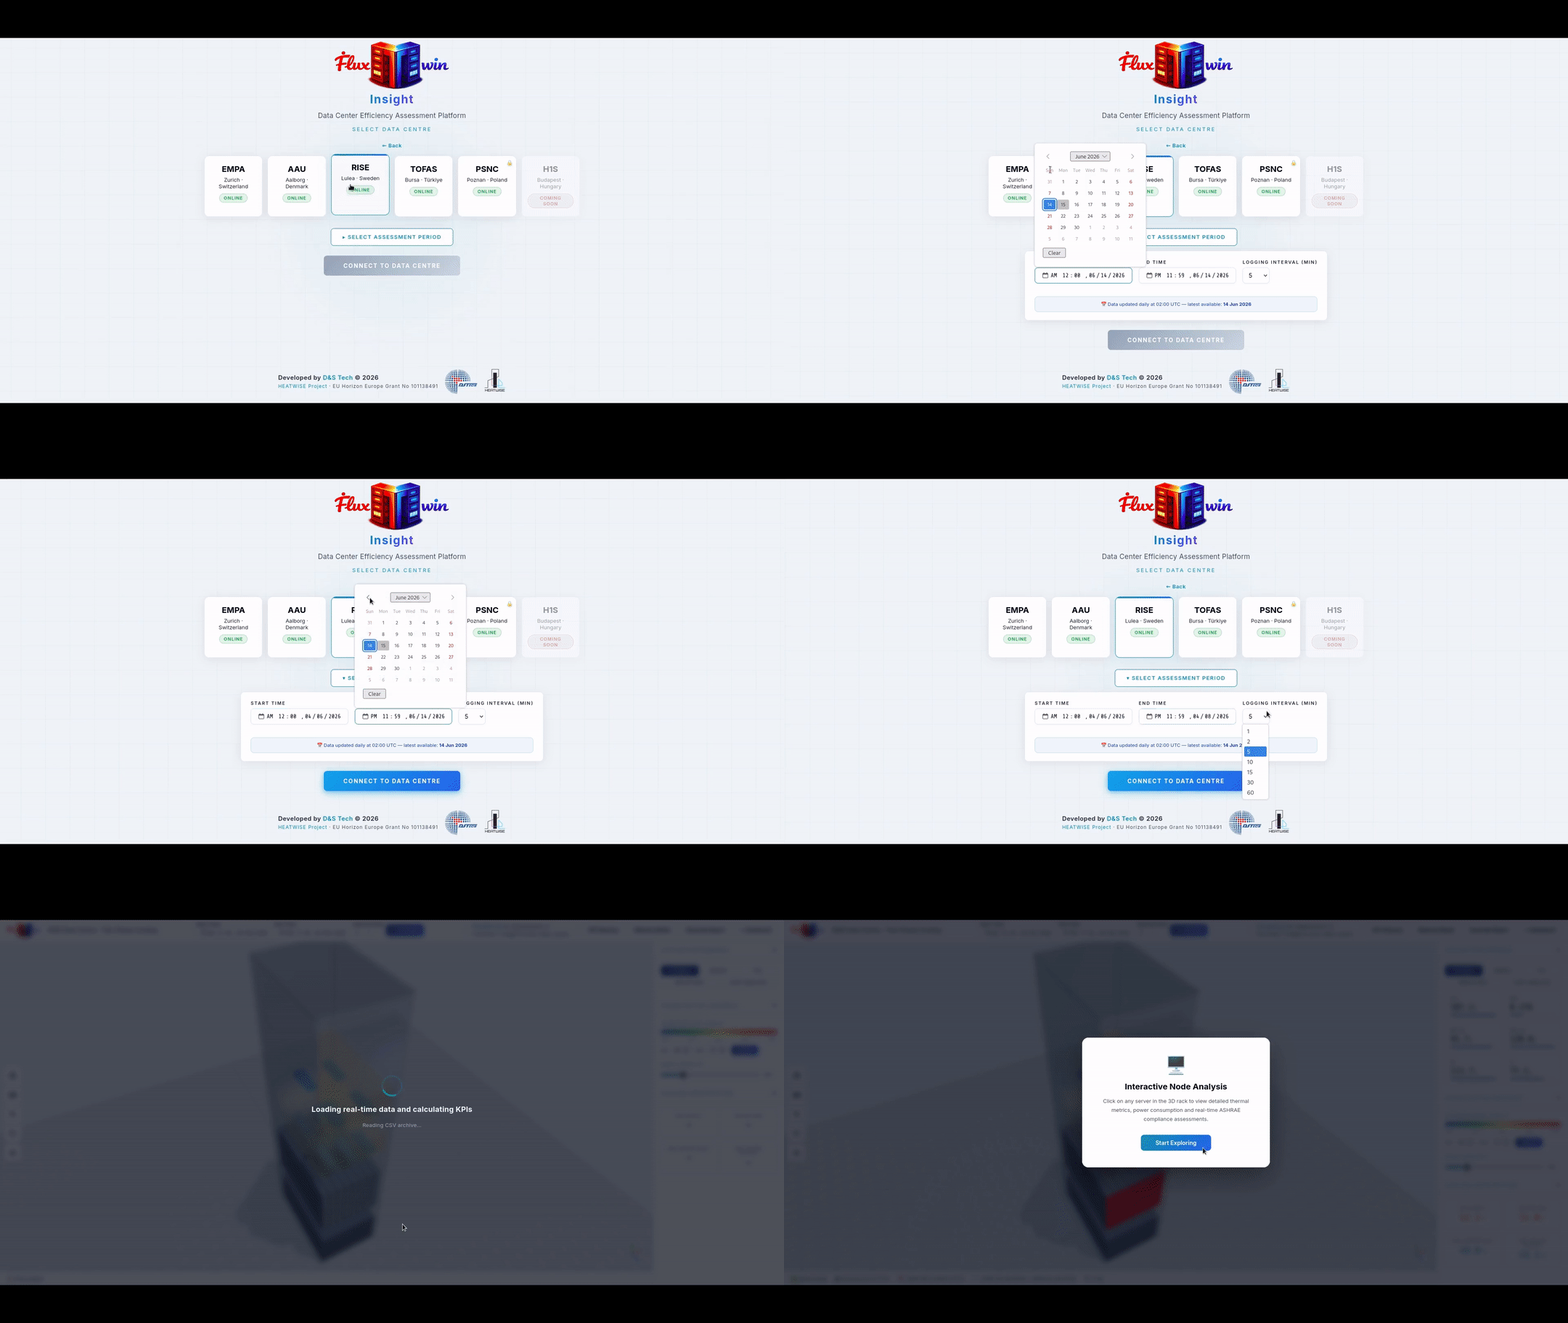
Step 2 — Set Assessment Period
Define the time range for your analysis. Select start and end dates, then choose the data interval (1 to 60 minutes). Click Update to load the data and populate the dashboard with real measurements.
Step 3 — Explore the Dashboard
Navigate the interactive 3D view of your data centre. Rotate, zoom and click on any server to inspect inlet/outlet temperatures, CPU load and power consumption. Explore System Performance KPIs including thermal, energy, waste heat and CO₂ metrics. Click any KPI card to view its time series chart.
Step 4 — Generate Report
Click Generate Report in the top bar to export a comprehensive PDF assessment. The report includes KPI summaries, server heatmaps, energy analysis, cost breakdown and strategic recommendations tailored to your data centre.